Analysis of 25 nm functionalized QDs using fluorescence-NTA with ZetaView® QUATT system
Application Note Download Abstract While it is uncertain how far the NTA community is able to push the limits of current technology in order to
0x consumables
5x faster switching
10x faster cleaning
12x fluorescence channels
∞x statistics
…and much more!
We measure your products in a measuring range of 0.8 nm to 300 μm, if possible in original concentration
To anticipate the answer: With the ZetaView®.
As the surface charge of a particle interacts strongly with the charge in its environment, a clean cell is a must. Invisible surfactants may coat the surface and change the ionic charge. During diluting the sample to the measurement concentration, the pH may change. The robust quartz cell guarantees easy cleaning. Internal pumps assist the rinsing process.
Depending on what sizes will be important to analyze, it is necessary to bring the concentration in balance with the camera settings. For known samples the SOP helps, for unknown the software contains a dilution assistant.
Up to the release of ZetaView® 2004, it was not possible to measure zeta potential with a first principle micro-electrophoresis set-up routinely. It was too complicated to align the optics to the stationary layers and to keep the focus sharp over a long time. With ZetaView® this is possible. As the ZetaView® was designed as a portable instrument, automation was a must. This is a strength of the instrument and guarantees repeatability and precision in concentration, size and sub-population analysis of nanoparticles, in scattering and fluorescent mode.
The scatter plot of zeta potential vs size with the new software 8.04.02 tops all that.
ZetaView® tracks the particles individually in a Laser Scattering / Fluorescing Video Microscope. By following the Brownian motion of the particles their diffusion size is deduced1,2. As soon as an electric field is applied, the particles start an electrophoretic movement. From the unidirectional movement, the electrophoretic mobility µe = v/E is derived, v being the velocity of the particles and E the applied electric filed. With some assumptions, sometimes philosophic, the so-called zeta potential ζ is derived (ZP). When we speak of ZP, it is only about particles moving in a polar liquid like water. This is more than Pareto for the reason, that ZP in any other liquids like organic represents high acrobatic thinking.
The higher the ZP (positive or negative), the higher is the repulsion force between the particles and the lower the probability for a collision with subsequent aggregating. As a simple aid to memory – not always correct – stands “30 mV”. Repulsion is dominant above 30 mV. For the aggregation, the Van der Waals attraction between surfaces is responsible. It starts below 30 mV and increases the nearer zeta potential approaches zero.
All this is written in detail first by famous scientists like Smoluchowski, Einstein, Stokes and colleagues, later by Hunter, Lagally and others. An excellent description is given in the ISO documents 13099:2008, part 1 (general) and 2 (optical methods). Part 3 (organic solvents) is in preparation. ASTM_E2834-12 is the corresponding American Standard. For literature references we recommend again the mentioned standard publication. Articles In simpler depiction you may find in our home page.
In a 90° scattering/ fluorescing microscope like ZetaView®, the electrophoretic mobility measurement is accompanied by the electro-osmosis effect. Electro-osmotic flux of the medium is a reaction of the mobile counter- ions in the liquid to the electric field. These counter ions carry a charge opposite to the cell wall. The electro-osmosis therefore reflects the polarity and amount of the ions sitting on the surface of the wall. The migrating ions drive the whole liquid, with the liquid also the suspended particles. Electrophoresis and electro-osmosis motion superimpose each other. The separation of both effects is possible only in the so-called “stationary layers”, where electro-osmosis is zero. These layers are shown by the 2 dashed vertical lines in Fig. 4 of the brochure (see below).
From looking to the velocity (here zeta potential) profiles of the liquid in figure 4, it is clear, that the location of the combined focus of the laser and the microscope must be controlled over the entire cross section of the cell. Scanning from one side (wall 0) to the other side (wall 1) is a must. The velocity profile is recorded and the electrophoretic mobility (zeta potential) taken from the 2 stationary layers. Particle Metrix takes full control of it. The user has not to take care about electro-osmosis influences.
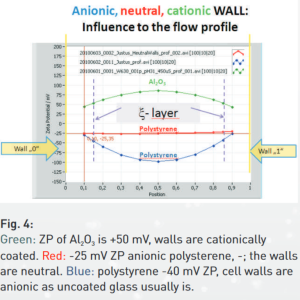
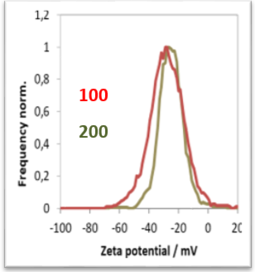
If the sample is very salty like a sample in PBS, convection may occur. To avoid this, the field is alternated at a sufficiently high repetition rate, so that the electrophoretic motion of the particles is measurable, whereas the motion of the total sample due to electro-osmosis cannot follow.
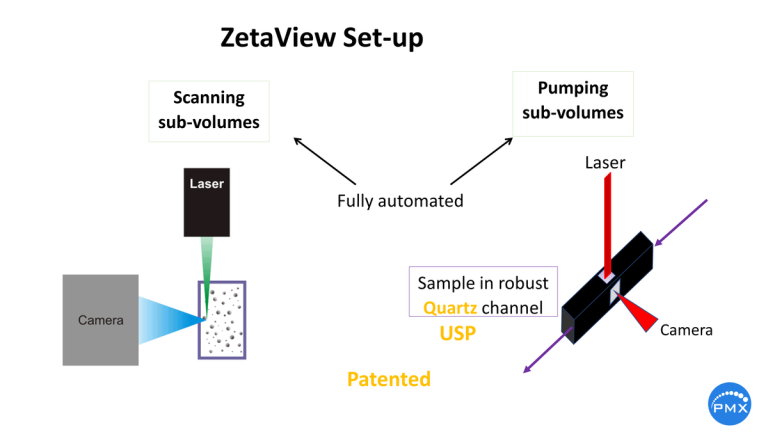
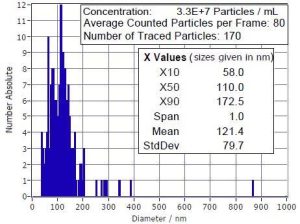
This scan helps not only in zeta potential analysis but is useful also to guarantee statistically valid size and concentration analyses by measuring concentration and size at all the 11 stops during a cell profile scan. The automatic measurement is shown below:
Programming a kinetic measurement where each profile scan is followed by a burst of 5 µl new sample, the statistical validity is boosting. See the next slide (or Video):
The following example shows the kinetics of zeta potential and size after adding 2 mM NaCl solution to a dispersion of 40 nm gold particles.
The kinetics is programmed in 2 steps, first by scanning 11 positions and, if wanted, second by pumping a new sample.
Zeta potential experiments are possible in the scattering and fluorescent mode of the ZetaView® NTA.
As an example
Application Note Download Abstract While it is uncertain how far the NTA community is able to push the limits of current technology in order to
After successfully showing C-NTA of double-stained MSC-EVs in our previous study (https://bit.ly/43GG0Yk) and confirming
the results with image flow cytometry, this note describes C-NTA of multi-stained MSC-EVs using a PMX-430 QUATT NTA
system with four lasers.
In this new application note we describe a quick determination of the physical titer of coronaviruses by fluorescence-based Nanoparticle Tracking Analysis and specific spike antibody recognition.
In this report, we describe the quantification of colocalization ratios on double-stained MSC-derived EVs using fluorochrome conjugated antibodies against the
cell surface antigens CD9 and CD41, which also serve as EV marker proteins.
In addition to using Nano Particle Tracking Analysis (NTA) to measurement the size distribution and concentration of EV samples, both Microfluidic Resistive Pulse Sensing (MRPS) and the Single Particle Interference Reflectance Image Sensor (SP-IRIS) methods have been widely used as an alternative means of characterizing EVs. In this note, we relay two specific cases for using the ZetaView® NTA system to achieve relative “high-throughput” analysis of many EV samples, along estimations of throughput for MRPS & SPIRIS methods for an equivalent number of samples; further, we establish realistic estimates for the high cost of ownership for operating MRPS & SP-IRIS systems as a result of the cost of consumables as well as the substantially greater amount of time spent to run the same number of samples.
Along with generally accepted methods are some “tricks of the trade” such as the addition of Tween® or BSA; however, some of those additions are problematic.
Headquarter
Support
Opt-out complete; your visits to this website will not be recorded by the Web Analytics tool. Note that if you clear your cookies, delete the opt-out cookie, or if you change computers or Web browsers, you will need to perform the opt-out procedure again.
You may choose to prevent this website from aggregating and analyzing the actions you take here. Doing so will protect your privacy, but will also prevent the owner from learning from your actions and creating a better experience for you and other users.
The tracking opt-out feature requires cookies to be enabled.